Geographically Diversified
Asset Portfolio
^
Operational Bed figures at IPO exclude Gurgaon CE and Mohali CE.
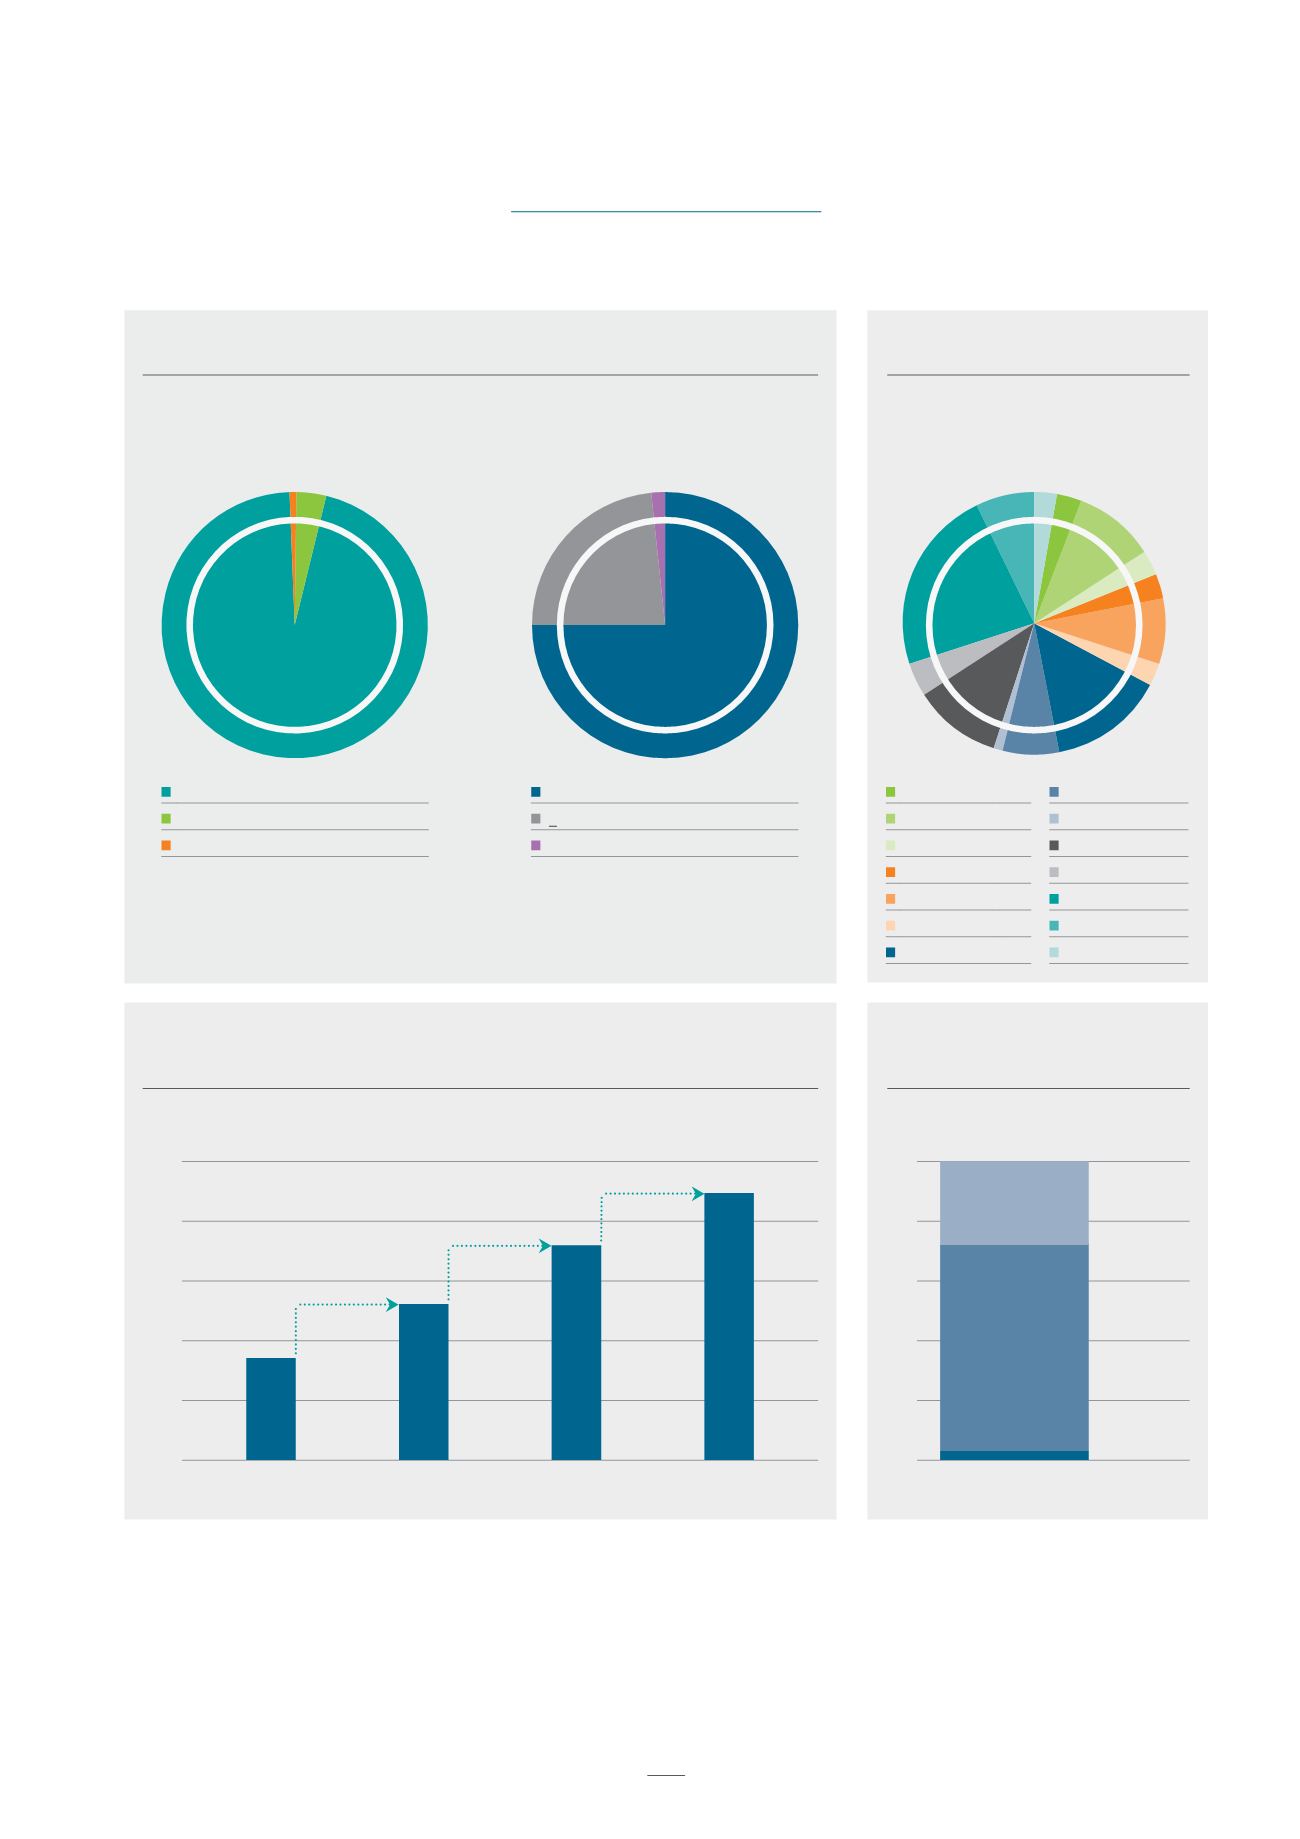
SOLID PORTFOLIO CHARACTERISTICS
NO SINGLE ASSET ACCOUNTS
FOR >25% OF RHT’S REVENUES
Income-generating
Assets Account for Vast Majority
of Portfolio
Substantial Portion of
Portfolio Comprise Long-Term
Lease/Freehold Land
RHT Clinical Establishments
95.5%
Greenfield Clinical Establishments 3.4%
Operating Hospitals
1.1%
Freehold
75.0%
> 50 years Remaining Lease Life 23.3%
< 50 years Remaining Lease Life
1.7%
Rajajinagar
3% BG Road
7%
Noida
10% Kalyan
1%
Faridabad
3% Mulund
11%
Amritsar
3% Anandpur
4%
Jaipur
8% Gurgaon
23%
Malar
3% Mohali
7%
Shalimar Bagh 14% Nagarbhavi
3%
Portfolio Valuation Breakdown (FY15)
(1)
The Gurgaon CE and Shalimar Bagh CE owned by FHTL 49% with 51% owned by FHML.
Currently, RHT has the 100% economic interest.
FY15 Revenue Contribution
STRONG GROWTH FROM
CAPACITY EXPANSIONWITH MINIMAL CAPEX
POTENTIAL TO PROVIDE
HIGHER END AND MORE
ADVANCED SERVICES
Portfolio Valuation % (FY15)
(1)
Number of Beds
(2)
4,464
3,590
2,607
1,706
OPERATIONAL BED
CAPACITY (AT IPO)
^
CURRENT OPERATIONAL
BED CAPACITY
INSTALLED BED
CAPACITY
POTENTIAL BED
CAPACITY
SECONDARY
TERTIARY
(3)
QUATERNARY
5000
4000
3000
2000
1000
0
100
(%)
80
60
40
20
0
901
983
874
3%
69%
28%
Note:
(1) Weighted by portfolio valuation. Assets are independently valued by the Independent Valuer in INR as at 31 Mar 2015.
(2) Current Operational Bed Capacity include those of Mohali Clinical Establishment. Installed Bed Capacity refers to the maximum number of beds that can
be operated at each hospital without further expansion. Potential Bed Capacity refers to the maximum number of beds that can operate at each hospital when
all stages of development are completed.
(3) Includes Secondary/Tertiary Services.
ANNUAL REPORT FY2015
25


